- Product
- Diagramming Build diagrams of all kinds from flowcharts to floor plans with intuitive tools and templates.
- Whiteboarding Collaborate with your team on a seamless workspace no matter where they are.
- Data Generate diagrams from data and add data to shapes to enhance your existing visuals.
- Enterprise Friendly Easy to administer and license your entire organization.
- Security See how we keep your data safe.
- Apps & Integrations Connect to all the tools you use from Microsoft, Google Workspace, Atlassian, and more.
- What's New Read about new features and updates.
- Solutions
- Product Management Roadmap features, brainstorm, and report on development, so your team can ship features that users love.
- Software Engineering Design and maintain complex systems collaboratively.
- Information Technology Visualize system architecture, document processes, and communicate internal policies.
- Sales Close bigger deals with reproducible processes that lead to successful onboarding and training.
- Resources
- Getting Started Learn how to make any type of visual with SmartDraw. Familiarize yourself with the UI, choosing templates, managing documents, and more.
- Templates get inspired by browsing examples and templates available in SmartDraw.
- Diagrams Learn about all the types of diagrams you can create with SmartDraw.
- Whiteboard Learn how to combine free-form brainstorming with diagram blueprints all while collaborating with your team.
- Data Visualizers Learn how to generate visuals like org charts and class diagrams from data.
- Development Platform Browse built-in data visualizers and see how you can build your own custom visualization.
- Open API The SmartDraw API allows you to skip the drawing process and generate diagrams from data automatically.
- Shape Data Add data to shapes, import data, export manifests, and create data rules to change dashboards that update.
- Explore SmartDraw Check out useful features that will make your life easier.
- Blog Read articles about best practices, find tips on collaborating, learn to give better presentations and more.
- Support Search through SmartDraw's knowledge base, view frequently asked questions, or contact our support team.
- Enterprise
- Pricing
- My Account
- Contact Sales
Product
-
Diagramming
Build diagrams of all kinds from flowcharts to floor plans with intuitive tools and templates. -
Whiteboarding
Collaborate with your team on a seamless workspace no matter where they are. -
Data
Generate diagrams from data and add data to shapes to enhance your existing visuals. -
Enterprise Friendly
Easy to administer and license your entire organization. -
Security
See how we keep your data safe. -
Apps & Integrations
Connect to all the tools you use from Microsoft, Google Workspace, Atlassian, and more.
Solutions By Team
-
Product Management
Roadmap features, brainstorm, and report on development, so your team can ship features that users love. -
Software Engineering
Design and maintain complex systems collaboratively. -
Information Technology
Visualize system architecture, document processes, and communicate internal policies. -
Sales
Close bigger deals with reproducible processes that lead to successful onboarding and training.
License Everyone For as Low as $5 per User per Month
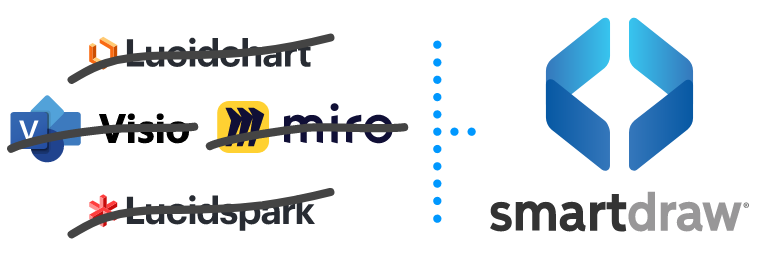
Save money, and replace Visio, Lucidchart, Lucidspark, and Miro with a SmartDraw site license.
Learn
-
Getting Started
Learn to make visuals, familiarize yourself with the UI, choosing templates, managing documents, and more. -
Templates
Get inspired by browsing examples and templates available in SmartDraw. -
Diagrams
Learn about all the types of diagrams you can create with SmartDraw. -
Whiteboard
Learn how to combine free-form brainstorming with diagram blueprints all while collaborating with your team. -
Data Visualizers
Learn how to generate visuals like org charts and class diagrams from data. -
Support
Search through SmartDraw's knowledge base, view frequently asked questions, or contact our support team.
Developer Resources
-
Development Platform
Browse built-in data visualizers and see how you can build your own custom visualization. -
Open API
The SmartDraw API allows you to skip the drawing process and generate diagrams from data automatically. -
Shape Data
Add data to shapes, import data, export manifests, and create data rules to change dashboards that update.
